OEE Monitoring In Manufacturing: Why is it important, What are the opportunities and challenges

OCTOBER 15, 2021 | OEE MONITORING IN MANUFACTUING:WHY IS IT IMPORTANT, WHAT ARE THE OPPORTUNITES AND CHALLENGES

Have you ever wondered if your machinery is operating at its full load capacity? Or perhaps you’ve seen numerous time losses in your equipment during various operations, resulting in a reduction of overall output but you can’t seem to find the source of the problem. A situation like this is precisely why overall equipment effectiveness helps solve and correct.

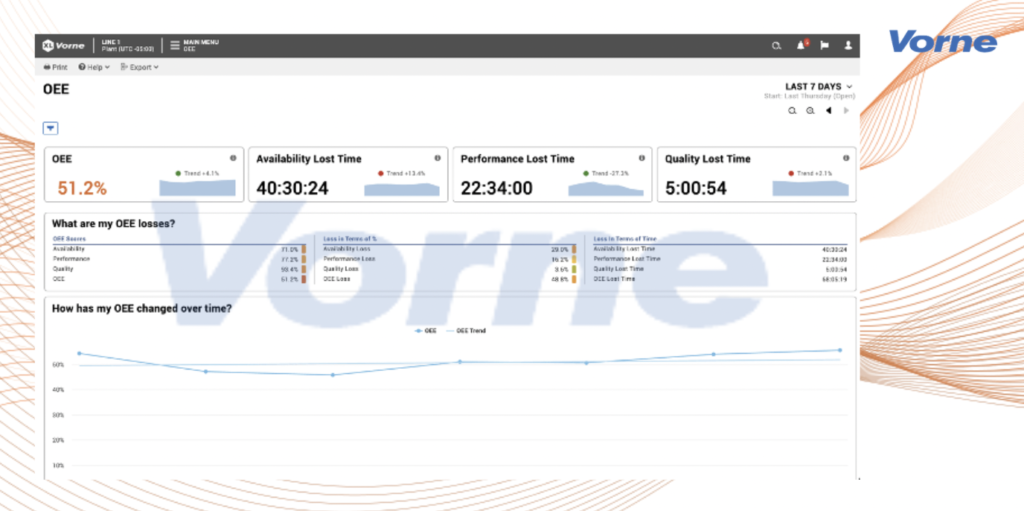
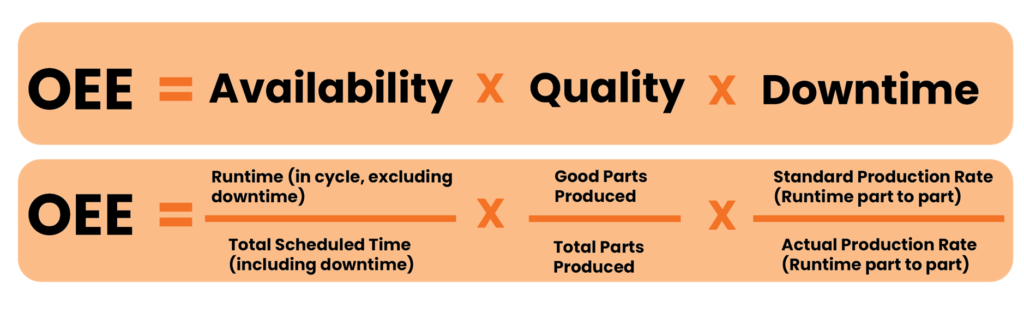
The term overall equipment effectiveness (OEE) is used to evaluate how efficiently a manufacturer’s operation is being used. OEE helps you identify the problems in your operations and determine which percentage of production time is truly productive and repair it while providing a consistent measure for measuring progress. Moreover, continuous improvement is the objective of measuring your OEE.

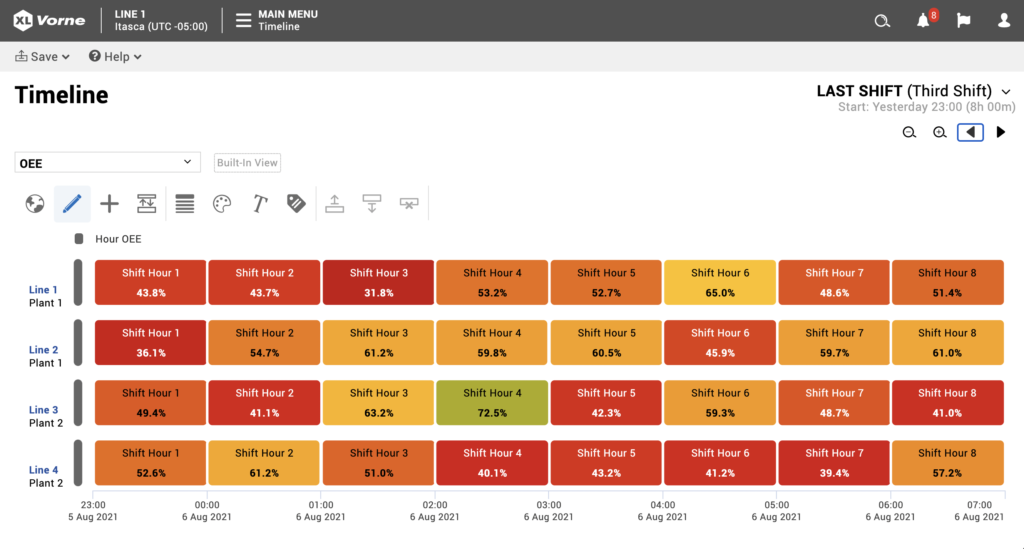
OEE is an important measuring tool that provides a lot of information in a single figure and there are multiple ways of measuring manufacturing productivity from OEE. When OEE is measured and evaluated correctly, it has the potential to maximize your production. The benchmark of OEE is used to compare any given production to industry standards and in-house equipment. The standard OEE benchmark is measured as follows:

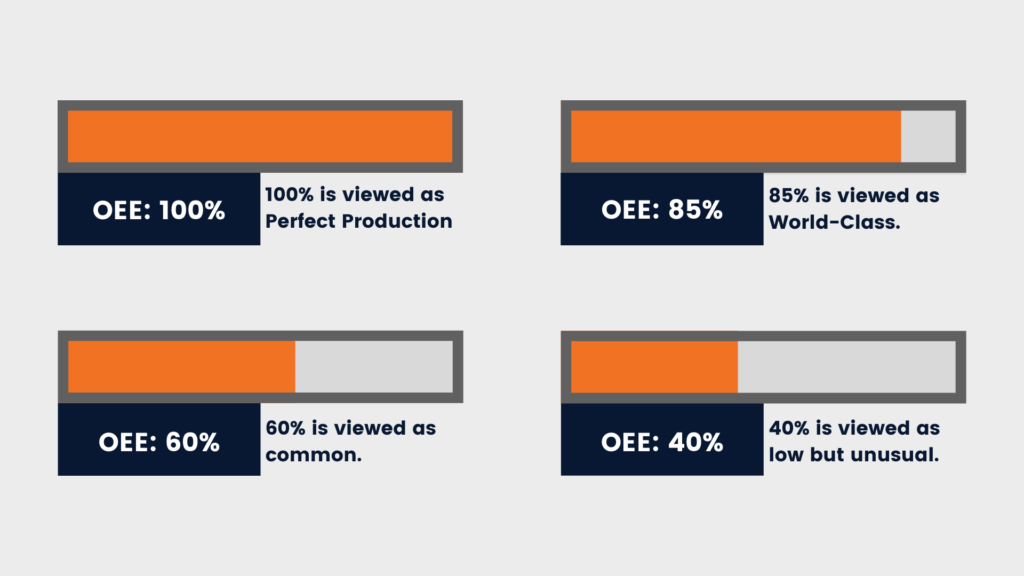
  • Perfect production is defined as an OEE score of 100 percent, which means you’re only producing high-quality components as rapidly as possible with no downtime.
  • For discrete manufacturers, an OEE score of 85 percent is considered world-class and is a long-term objective.
  • A 60 percent OEE score is common for discrete manufacturers, indicating that there is still a lot of opportunity for development.
  • An OEE score of 40 percent is considered poor, but it’s not unusual for manufacturers that are just getting started with performance tracking and improvement. In most situations, a poor score may be readily improved by using simple steps.

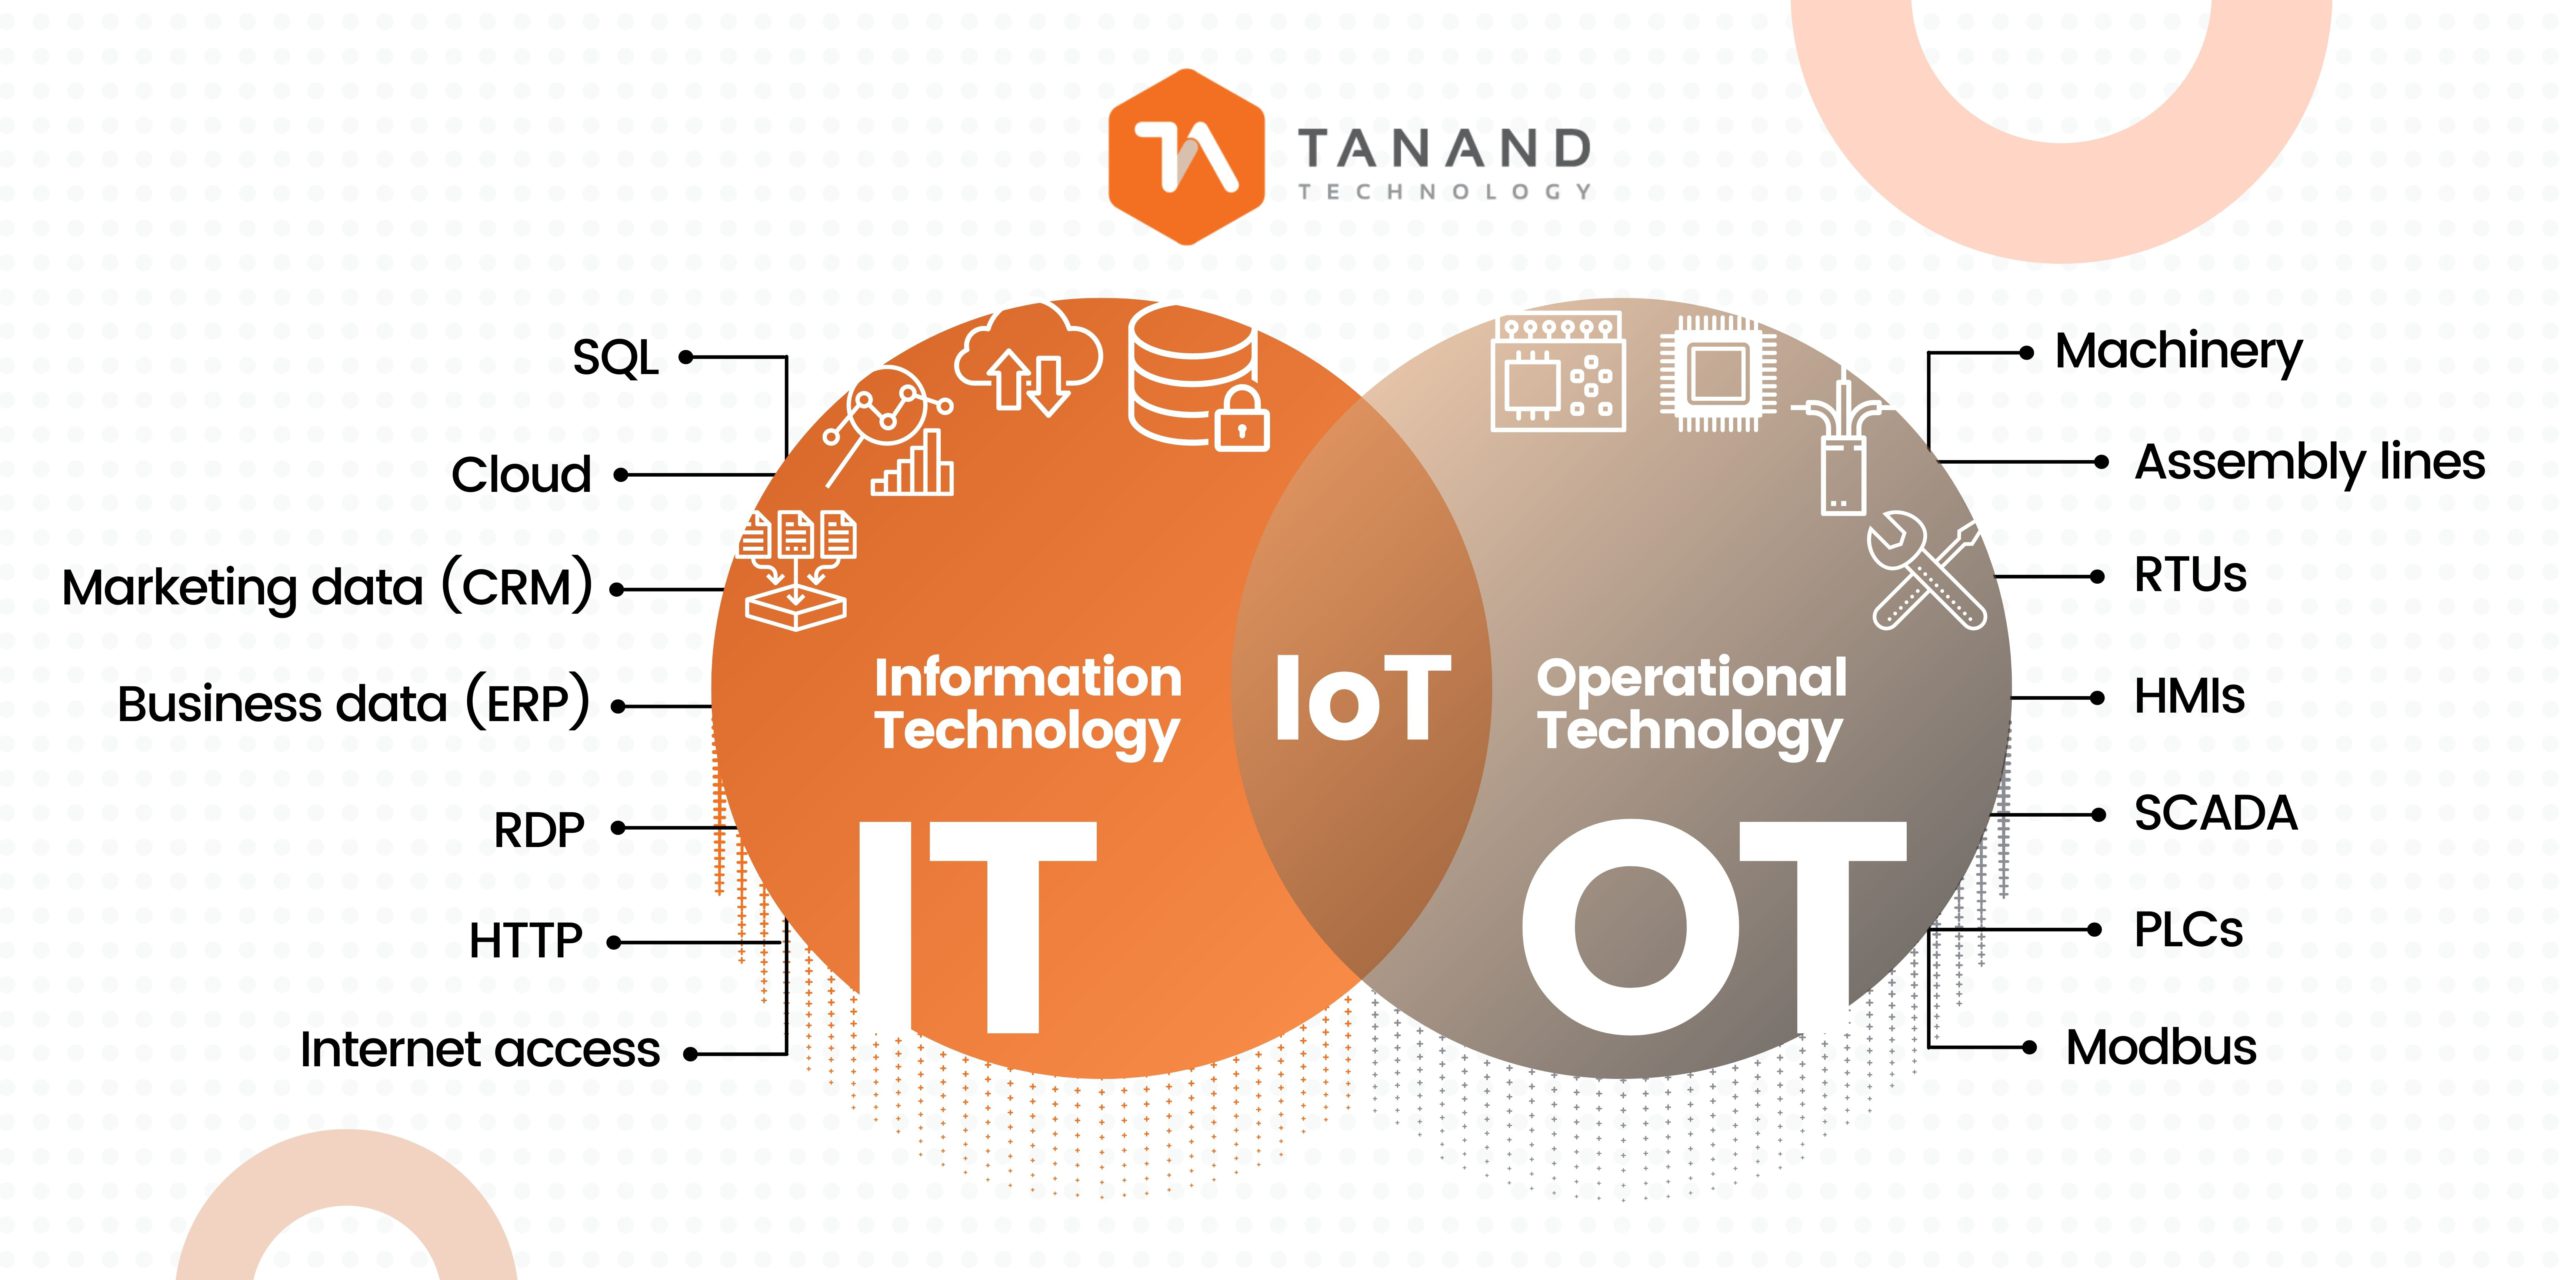
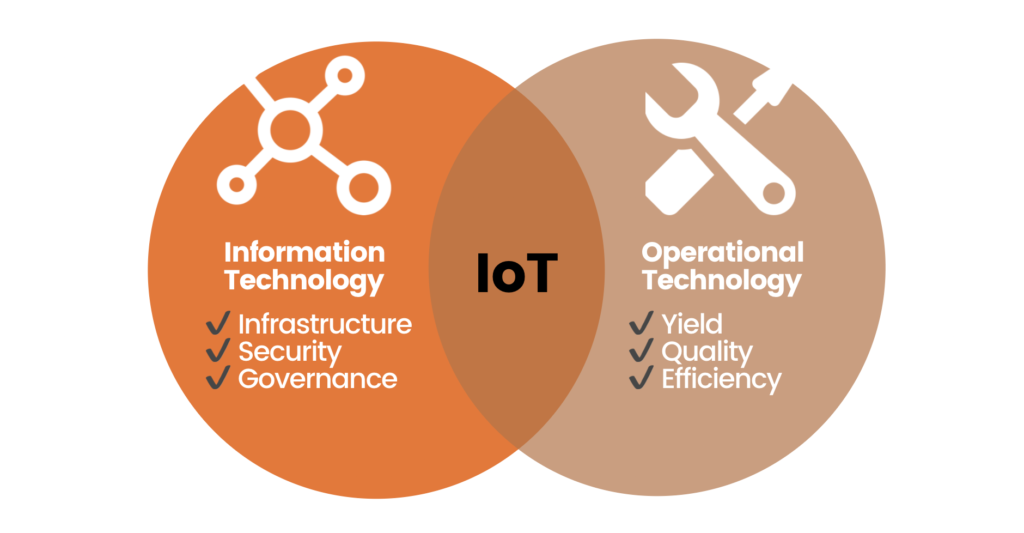
Continuously measuring OEE requires you to obtain different sources in different times frame such as connectivity between different management systems (ERP, MES), equipment sets, IoT devices and staff reporting (tablets, screens). 

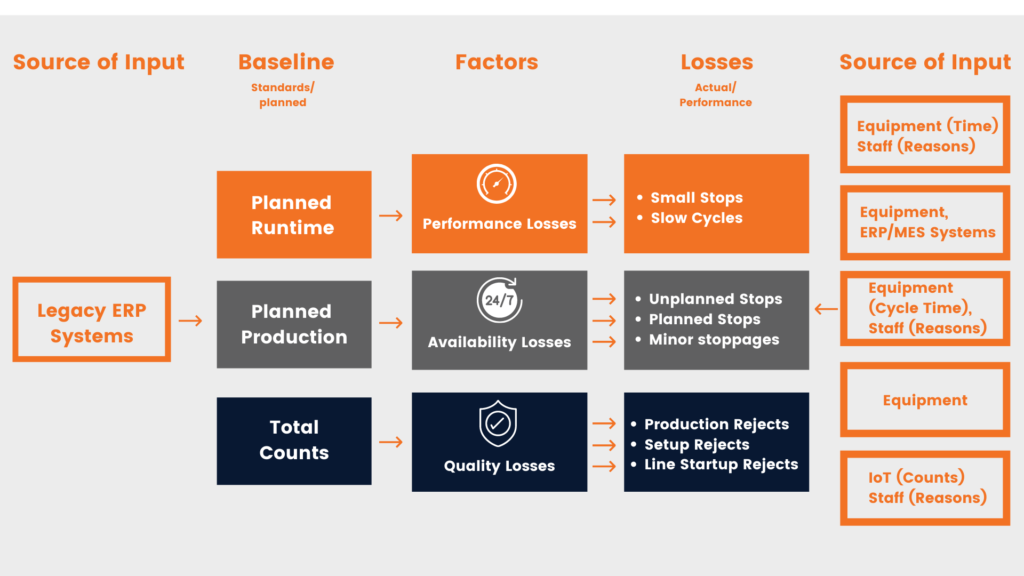
With production line producing more than one product, it makes sense to manage OEE in the context of the specific product and specification which correlates to the two key OEE parameters, Availability and Efficiency.

Opportunities

  • By using OEE management, data collection is more accurate than manually inputting on a spreadsheet.
  • OEE can be an important tool in balancing tasks and responsibilities in your manufacturing
  • OEE can help you understand how to increase profit through increased Availability

Challenges

  • It is easy to collect any data of machine faulty but when there’s too much data, it becomes a mess that makes it difficult to identify the real issue. Collect less data, do it effectively, and then make judgments based on that data. The value of data is determined by how it is applied.
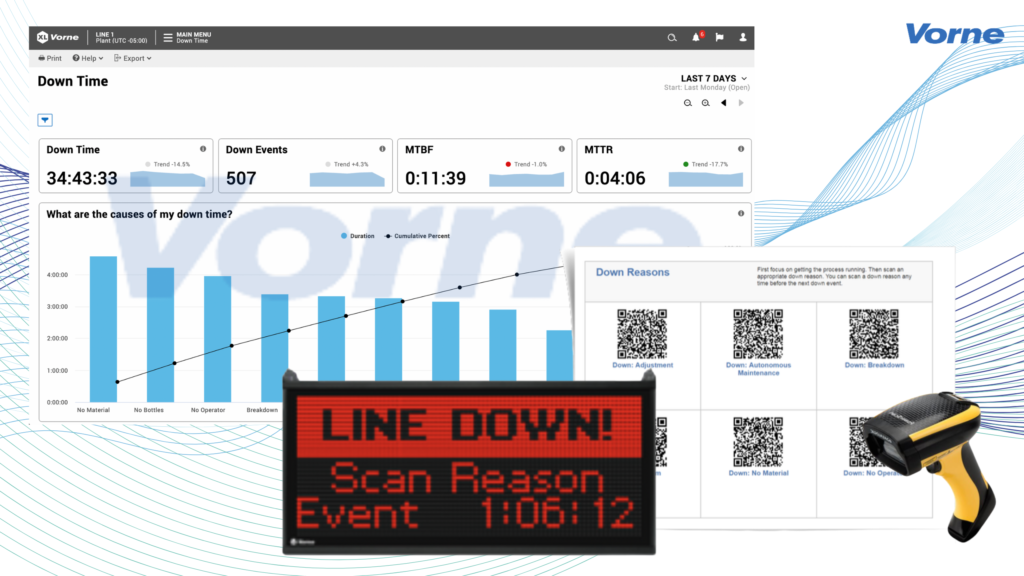
  • Human interpretation still needs to remain in the core element of OEE study and calculation. When a machine goes down, part of the line control system (the data collecting software) should be able to immediately tell the status change, but this is not always the case. This is where we need to validate the data and correct the software setup which requires humans to collect the data and understanding the contributing factors behind the numbers.

Benefits of using Overall Equipment Effectiveness (OEE) to improve production

Implementing an overall equipment effectiveness strategy can help you meet your production goals. It enables you to fine-tune production processes in real-time, decreasing downtime, boosting capacity, lowering cost, enhancing the quality, and increasing efficiency.

  1. Return of Investment (ROI): Your company heavily invests in machinery, and it is crucial to receive the maximum return of investment. When using the OEE strategy, it may have a significant impact on your bottom line by producing more products on the same equipment at the same time.
  2. Maximize Workforce Productivity: OEE can help you figure out why you experience operator downtimes, provide productivity statistics, and highlight delayed changeovers or setup times. This type of information helps in resource allocation, identifying areas of surplus capacity and determining where additional personnel are required.
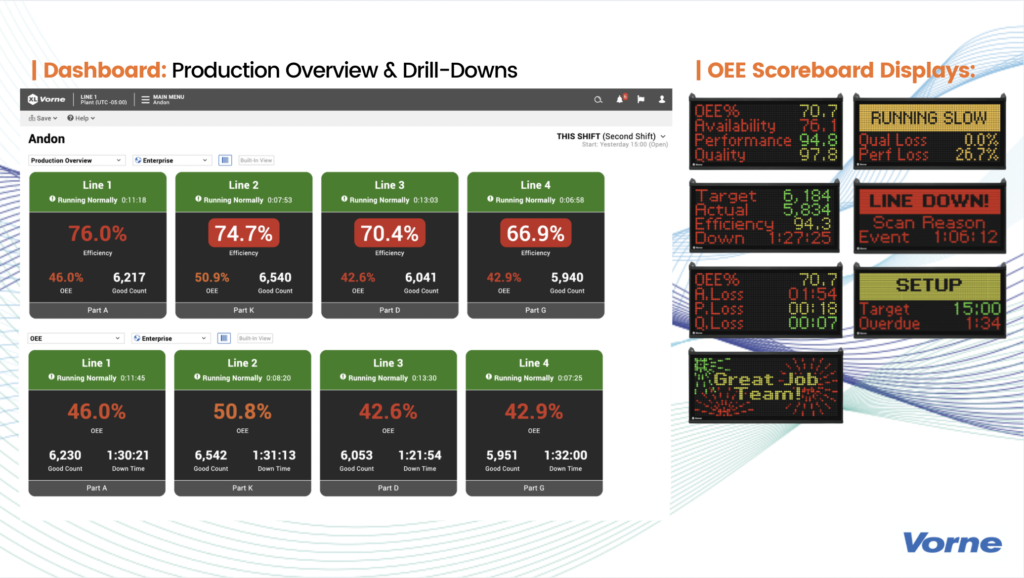
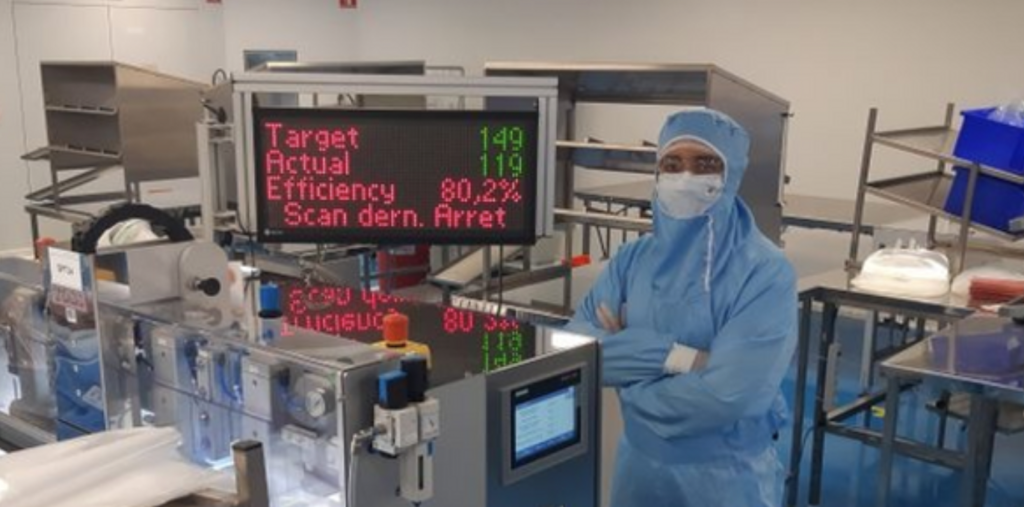
  3. Easily Visualize Performances:  Overall equipment effectiveness focuses on visibility, allowing you to visualize production difficulties rather than relying on your best estimate. Everyone can see what is working and where improvements are required by combining the major drivers of productivity losses into a single percentage.

Ready to Leverage Real-Time Location System (RTLS) In Your Industry?

SEPTEMBER 15, 2021 | REAL-TIME LOCATION SYSTEM, LOCATION SYSTEM INSIGHTS, AUTOMATION INSIGHTS

As digitalization and automation are the trend-setting developments surrounding industry 4.0, it is essential to adopt a centralized intelligent system to help improve and sustain the work of humans and machines.

A real-time location system (RTLS) is one solution that has received much attention to be a cost-efficiency solution. It has made a significant contribution to the overall industrial environment, but how does the implementation of RTLS significantly contribute to your industrial environment?

There is a critical ingredient to success when it comes to efficiency improvements: data.

An effective industrial environment is more of a guessing game than an intelligent and efficient operation without real-time data. The decisions you make would not be known if they had a good impact until weeks or months after the changes were implemented. This is where RTLS eliminates the assumed factors of your operation by delivering quick real-time data of your industrial environment.

Inventory/ Asset Tracking

Keeping track of critical assets/inventory is crucial for your manufacturing factory. Manufacturing pieces of equipment is essential for the company, and they are considered an expensive asset that needs to be maintained and located at all times. Inability to track your assets/inventory can disrupt the company production efficiency and production line.

Production Lead Time

In a conventional factory, workers must pick and pack assets by searching through racks and shelves, sometimes spending a longer time when certain assets are misplaced. When manual asset recording processes are used, it is more prone to errors with time delay because assets are usually not recorded immediately when it reaches the warehouse.

Material Shortage and Downtime

When a material run-outs at any production station, it causes a line stop and loss of productivity. It takes time for workers to respond to them and this also results in coordination breakdown.

Industrial Safety

Globally, industrial safety is becoming more critical, with government and regulatory bodies enacting higher safety standards that businesses must comply with. At times, manual staff tracking and accountability are highly inaccurate during emergencies. Moreover, the process is also time-consuming, and due to industrial sites typically in a large area and workforce, it is impossible to act urgently.

The benefit of RTLS:

  • Protecting assets and equipment with real-time information
  • Increasing production lead time by accurately locating assets and recording necessary asset data quickly
  • Improving efficiency between production workstations and monitoring work in progress
  • Monitoring a large area of industrial environment activity to monitor workers’ safety and hazardous area

RTLS Technology (BLE/ Active RFID/UWB)

RTLS configuration varies widely depending on the type of facility in which the technology is employed. With various components of RTLS technology such as Bluetooth Low Energy (BLE), Active RFID, and Ultra-wideband (UWB), it sends the data signal to the server to determine the location of the devices. Each component varies in ranges, accuracy, and battery lifetime to suit the industrial environment.

The choice of the most suitable technology depends on several factors:

  • (Precision) requirements for the system
  • The conditions on site
  • The number of assets to be tracked
  • Budget

Ready to implement an RTLS solution in your industrial environment? Kindly refer to the video below for more information, and contact us for a private e-meeting to start your RTLS journey, we are happy to help you to choose the right technology for your project.

Information Technology (IT) & Operational technology (OT) Convergence: How Does It Benefits Digital Manufacturing

AUGUST 10, 2021 | INFORMATION TECHNOLOGY, OPERATIONAL TECHNOLOGY, EDGE COMPUTING, IOT, MANUFACTURING, ENTERPRISE SOFTWARE, MACHINE LEARNING

As new technology brings operational hardware online, the border between Information Technology (IT) and Operational Technology (OT) is blurring – but what is the difference between IT and OT in the first place?

In summary:
IT is concerned with data, in other words, IT is in charge of digital data flow.
OT, on the other hand, is concerned with machinery, which means OT is in charge of the operation of machinery and the physical processes that carries them out.
– A useful comparison to describe their difference is: while IT happens in the office and is more often associated with software, OT happens on the production floor and is more often associated with hardware.

It’s important for key decision-makers in the manufacturing industries to comprehend the differences between IT and OT and how each domain can interrelate. Given the rapid development of Internet of Things (IoT) and its broad acceptance across the industry, manufacturers ought to spend on next-generation solutions that can bring IT and OT together to better analyze and control critical production asset and processes.

Information Technology (IT)

Simply stated, information technology (IT) is the use of the network, storage, and computing resources to generate, manage, store, and transport data within and between companies.

Some prominent features of IT includes:

1. IT has the ability to be reprogrammed.

While some technologies are built to execute a specific set of tasks (e.g. a piston), IT can be changed, enhanced, and reprogrammed in a variety of ways to suit changing networks, applications, and user requirements.

2. Other than software, IT also associates with hardware that relates to connectivity.

IT not only includes software, such as applications, operating systems, and virtualization capabilities, but also hardware, such as computers, physical servers, network equipment and so on.

Operational Technology (OT)

Operational technology (OT) can be defined as the technology that analyzes particular systems and technologies inside business operations at the most fundamental level.

Unlike IT, the hardware and software associated with OT are typically:
– intended to accomplish very particular tasks, such as regulating temperature, evaluating mechanical performance, activating emergency shutoffs, and so on;
– accomplished using industrial control system (ICS) and supervisory control and data acquisition (SCADA).

A prominent feature of OT is that OT requires human intervention at certain critical points.

OT offers a fast and direct, yet physical method, such as a switch, a steer level, or a big red button, for workers on the manufacturing floor to carry out specific operation of machineries, such as adjusting temperature or humidity level, turning off equipments etc.
On the other hand, IT is able to execute essential activities without the need for continuous human involvement – as long as the processes remain within pre-programmed parameters.

The Convergence of IT & OT – Internet of Things (IoT) Technology

Although IT and OT have traditionally been separate aspects of contemporary companies, the boundaries between the two are melting and changing due to a process known as IT-OT convergence. Since IoT technology connects assets that aren’t usually linked to the internet — manufacturers looking to transition into a smart business may now generate new efficiencies by using the flexibility and connectivity expertise of IT to the physical assets of OT systems.

IoT can convenient production floor operators by maximizing visibility of machine performance and control of machine utilization.

Using IoT to Achieve Energy & Process Optimization in Tanand

A plug-and play solution enabled by IoT and deeper analytics tailored for energy and production monitoring to improve downtime management, manpower, quality of service and reduce costs of operation.

RTMA provides accurate insights for faster decision making, empowering your production team to:
Remotely monitor & centralize all your data in real-time to maximize facilities and resources
Stay informed with instant notifications by tracking server / router / application / machine downtime to know when certain thresholds or parameters are breached
Get visual feedback into energy consumption and production performance by combining and analyzing machine, energy, process data, PLC, SCADA, and IoT sensor data
Achieve predictive condition monitoring by implementing a demand-based maintenance scheduler tool that automatically prioritizes maintenance, as well as serves as a KPI measuring tool to evaluate maintenance

Top 4 KPI Dashboards in Tanand to Suit Every Manufacturing Needs

JULY 28, 2021 | LEAN MANUFACTURING, PRODUCTION LINE MONITORING, MANUFACTURING INSIGHTS

Manufacturers are attempting to accomplish more with less, run more efficiently, and make informed purchasing and management decisions these days. But, in order to do so, the management team must always be aware of what is going on in the production and why it is happening.

While some plant activities can be tracked manually, a machine monitoring system is the most efficient and thorough way to do so. Even so, not all data is created equal—and, let’s face it, plant managers have a lot on their plates. As a result, we’ve put up a list of the top six KPI dashboards that every manufacturer should keep an eye on in order to plan and manage effectively.

If you currently have a production monitoring system, concentrating on these dashboards and KPIs will help you get most out of it. If you haven’t yet purchased one, this is a short way to discover what Tanand can do—and why now could be the best moment to do so.

KPI Dashboard #1: At-a-Glance Plant Floor Activity with Real-Time OEE Displays

Overall Equipment Effectiveness (OEE) is crucial in identifying the percentage of planned production time that is truly productive. An OEE score of 100% represents perfect production: manufacturing only good parts, as fast as possible, with no down time. OEE score answers questions such as: At any given time, do you know which machines are operating and which are idle? How long does it take to set up a certain job? Is the target achieved for today?

You should keep an eye on the following things in particular:

  • Production state (Idling, downtime, producing) 
  • Line status (e.g. running, stopped, changeover)
  • Parts produced (In count: good counts vs. rejects)
  • Availability, Performance, and Quality Loss (usually lost time within the shift, job, or part run)

OEE reports are records of what happened in the past. OEE displays are records of what is happening right now – an opportunity to change history before it happens. With plant floor electronic displays that convey OEE and other KPIs performance data in real-time, your team can address issues and solve challenges as they occur with:

  • Visual cues to alert when special attention is needed
  • Contextual information such as down time during breakdowns, target time for changeovers, and remaining time for breaks
  • Automated data capture for high resolution and accuracy

Supervisors making endless rounds on the shop floor will not be able to tell you this as effectively as a solid OEE system will. An effective production monitoring dashboard encourages manufacturing plants to better define the role of plant floor employees to address questions such as:

  1. What does “green condition” mean?
  2. When should an operator call for maintenance?
  3. When should an operator schedule production downtime?

You can use this intelligence to take preventative measures like:

  • Enable operators to call for help as needed (e.g. from maintenance or supervisors)
  • Setting realistic delivery expectations  
  • Planning ahead when overtime is needed
  • Deploying supervisors only where they’re needed

KPI Dashboard #2: Machine Downtime

You can’t increase output unless you figure out what’s slowing you down. Monitoring downtime identifies bottlenecks and provides a roadmap for improving performance, hence production monitoring system should be able to pinpoint the sources of downtime by replacing manual tracking of down time with automated tracking (track down time based on equipment inputs rather than operator tick sheets).

Automatically detect your down time using a single input from your equipment (usually an existing sensor that counts parts or equipment cycles)with sub-second accuracy using Vorne. Xl. The XL scoreboard shows down time in real-time on the plant floor and XL provides down time information to employees everywhere using patented technology and its integrated web server.

The dashboard will be able to address questions such as:

  • What are the causes of the downtime?
  • Which parts have the biggest downtime impact?
  • What are the down time trends, top and most most frequent down losses?
  • How does the down time vary by shift and part?

KPI Dashboard #3: Workforce Performance

When it comes to enhancing performance—creating accountability and providing targeted incentives—having access to data and facts is the first step.

Your best performers will be identified through a good KPI system, and you will be able to reward and recognise them. Simultaneously, it determines whether operators are efficient in completing their job by providing a historical trail of when events had happened and the details of the follow-up performed.

It is applicable to suituations where:

  • to ensure dynamic roster / scheduling and reduce idling when it is challenging to supervise all the operators working in a large area, e.g. cleaners or trolley operators in an airport
  • to provide real-time tracking for manpower efficiency when you want to ensure timely completion of tasks, e.g. when maintenance operators go into their designated zone for machine check-ups

KPI Dashboard #4: Your Plant’s OEE

OEE is most valuable when it
(a) categorizes causes of lost production time,
(b) as accurately or brutally as possible,
(c) as a basis for improvement activity.

It’s representative for how your equipment is running, and that the score is improving over time.

You receive a complete picture of your production OEE when you track your plant’s availability, quality, and performance at the highest levels. You can now spot and correct problems as they arise, ensuring that your operational goals are met and exceeded.

  • Production Monitoring & OEE

RTMA-OEE is embedded with standard dashboards showing availability, performance, and quality management, which allows detailed monitoring at-a-glance to empower operators to meet production goals by identifying bottlenecks in real-time for continuous production improvements.

  • Historical Analytics Comparison Across Lines

Historical performance and production analytics help determine if jobs will be delivered on-time. Visualize, analyze and optimize actual cycle times (hourly, daily, weekly & monthly; minimum, maximum & average) of multiple machines and lines across production floors for real-time OEE dashboards and historical reporting.

We are passionate to be the technology enabler to realize world’s smartest, most optimized & adaptive buildings & manufacturing processes that save money & improve productivity through the convergence of accelerated technologies & real-time data driven analytics.

Real-Time Demand Control in HVAC Optimization for Cleanrooms: Chilled Water Energy Optimization and Predictive Condition Monitoring

JULY 10, 2021 | CLEANROOM TECHNOLOGY, PREDICTIVE CONDITION MONITORING, HVAC ENERGY SAVING INSIGHTS

Cleanrooms requires high energy usage, and it’s typical for power requirements to be specified based on standards rather than a thorough grasp of the dynamics. Cleanrooms require a significant amount of energy – ranging from 2 to 50 times that of non-classified spaces, depending on the application.

Despite knowing that, it is challenging to achieve energy savings in cleanrooms because of the stringent conditions they adhere to, such as maintaining a temperature control limit of below 26°C, a humidity control limit of below 60%, additional positive pressure in the sealed area and so on.

With overcooling as the only method to maintain the temperature control limit for a cleanroom, not only it is producing energy wastage, air balancing issues and hot spot areas are also hard to identify due to the limited availability of sensors (typically 1 sensor per 5k-10k sqft) on the production floor of a semiconductor manufacturing plant.

Not to mention that measuring dust particulate concentration is normally performed via manual sampling method and not on a real-time basis, such reactive and corrective measurements would have already caused defects to products, easily wasting millions in value during just a single shift.

Higher Feedback Accuracy with Real-Time Sensors to Maximize Cleanroom Energy Savings and Minimize Product Defects

Tanand places various real-time wireless sensors throughout the production floor to automate energy consumption and prevent air contamination through heat-load balancing and indoor sensors.

  • Our non-invasive temperature, humidity and pressure sensors can be easily clipped-on via Velcro patch without complicated and dusty wiring works that will cause cleanroom operation downtime.
  • Our sensors can be linked to your Wifi network, Power over Ethernet (PoE) and LoRa, which will then be able to work independently without the need to upgrade your existing cleanroom infrastructure.
  • Although our sensors can run purely on Lithium battery (1-2 years of lifespan with a single charge), they can be also be powered up by any 5Vdc power source in the cleanroom through a micro-USB.
  • Our cleanroom-standard dust particulate sensors can detect PM0.5 air in real-time using optical sensing method.

A Smart HVAC Solution That Is Beyond Temperature Control

  • Dynamic air side balancing with real-time demand control algorithm.
  • Dynamic chilled water balancing with real-time chiller set point & part load optimization.
  • Access to various inputs such as heat loads, humidity, zone-specific temperatures, airflow temperatures, weather, occupancy and so on.
  • Instant alert via Telegram or WhatsApp when operating control limits thresholds (e.g. temperature, humidity, pressure, dust particulate) are exceeded.
  • Save installation cost, implement fast and reap significant savings!

Improving Chiller Lifespan with Predictive Condition Monitoring

Chiller is not only the most important workhorse, but also the most expensive asset in a building. Hence, chiller can easily be the biggest power consuming equipment in your cleanroom.

With the unique features of EasiChiller:

  • Prolong your chiller lifespan with predictive conditioning monitoring specifically designed for chiller
  • Powered with IoT sensors (energy, noise, vibration, flow/delta T) for real-time scanning and machine learning fault analysis through your chiller logs (EasiChiller+)
  • A Data-Driven Chiller Expert to monitor your critical chiller 24×7 with trend analysis
  • Monthly summary report for your chiller health score & historical scoring trend via email to never miss any insights
  • Instant notifications for your operation team via Telegram or WhatsApp to detect potential faults and major damages before they occur
  • Analyze & audit the performance or health score of your chiller after every maintenance job

Easily achieve the benefits:

  • Save energy – Chiller performance will be closely monitored to ensure energy efficiency
  • Reduce workload issues – Avoid under-maintenance that causes unpredicted chiller breakdowns & over- maintenance that causes unnecessary chiller or spare parts replacements
  • Increase chiller lifespan – While a normal chiller lifespan is around 15-20 years, a well-maintained chiller with predictive condition monitoring can easily operate up to 25 years. That additional lifespan of 5 years in your chiller with a capital expenditure of RM500,000 will save you RM125,000.00 – RM166,667.00.