JULY 28, 2021 | LEAN MANUFACTURING, PRODUCTION LINE MONITORING, MANUFACTURING INSIGHTS
Manufacturers are attempting to accomplish more with less, run more efficiently, and make informed purchasing and management decisions these days. But, in order to do so, the management team must always be aware of what is going on in the production and why it is happening.
While some plant activities can be tracked manually, a machine monitoring system is the most efficient and thorough way to do so. Even so, not all data is created equal—and, let’s face it, plant managers have a lot on their plates. As a result, we’ve put up a list of the top six KPI dashboards that every manufacturer should keep an eye on in order to plan and manage effectively.
If you currently have a production monitoring system, concentrating on these dashboards and KPIs will help you get most out of it. If you haven’t yet purchased one, this is a short way to discover what Tanand can do—and why now could be the best moment to do so.
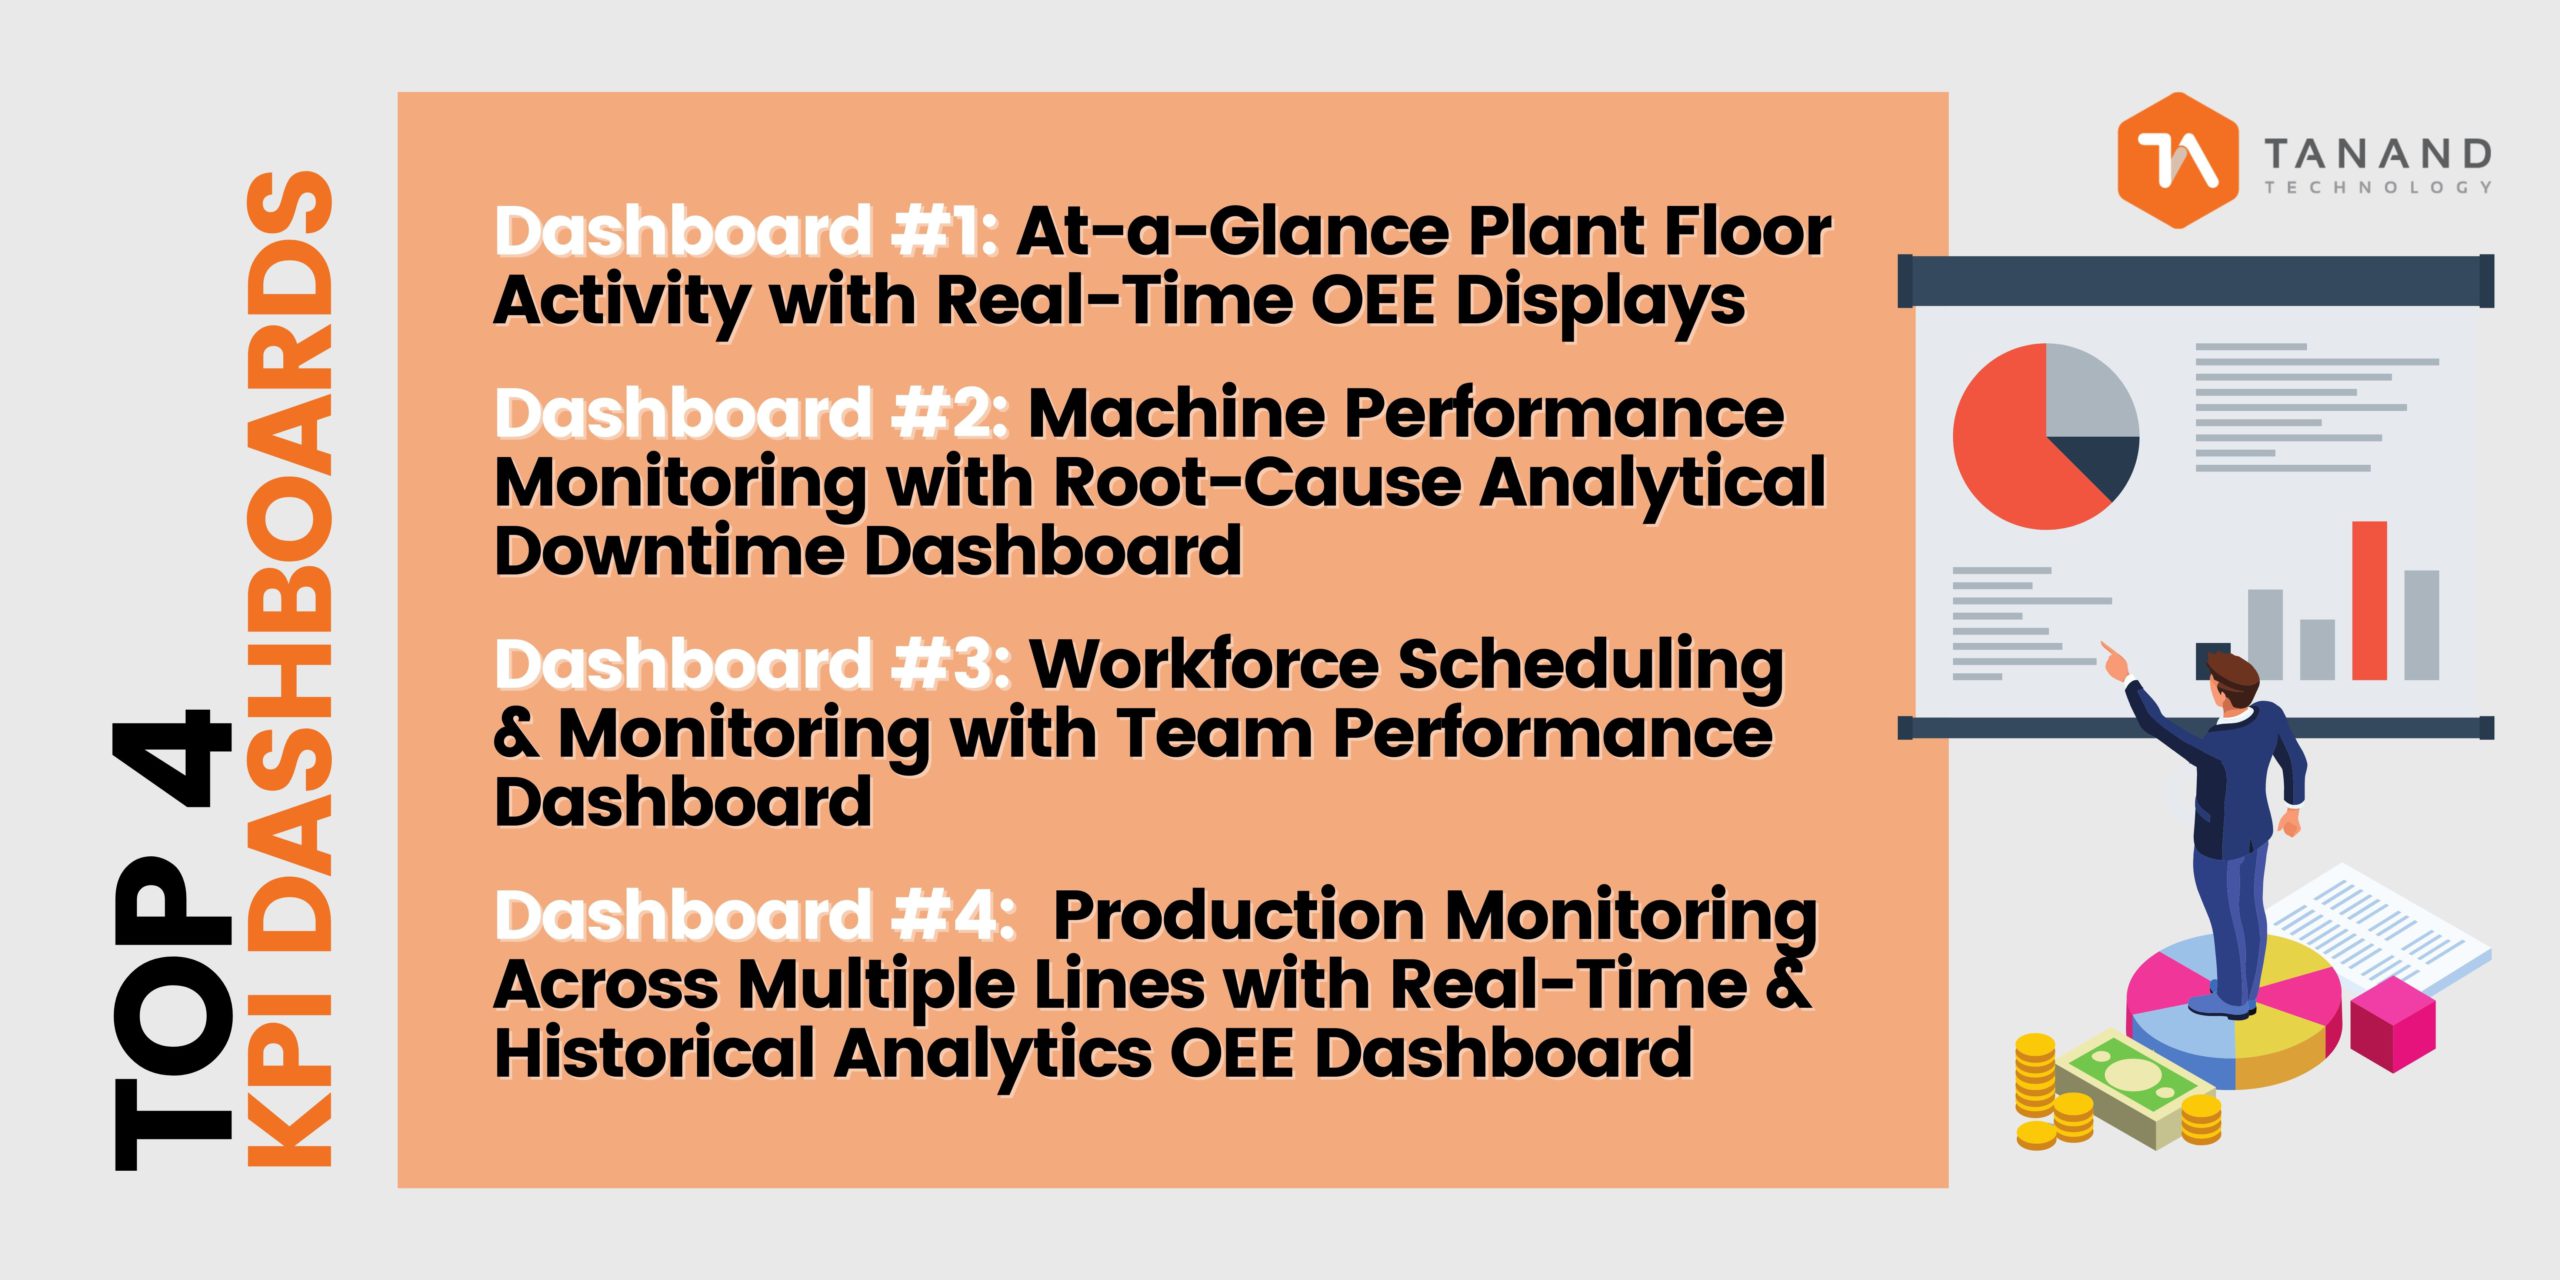
KPI Dashboard #1: At-a-Glance Plant Floor Activity with Real-Time OEE Displays
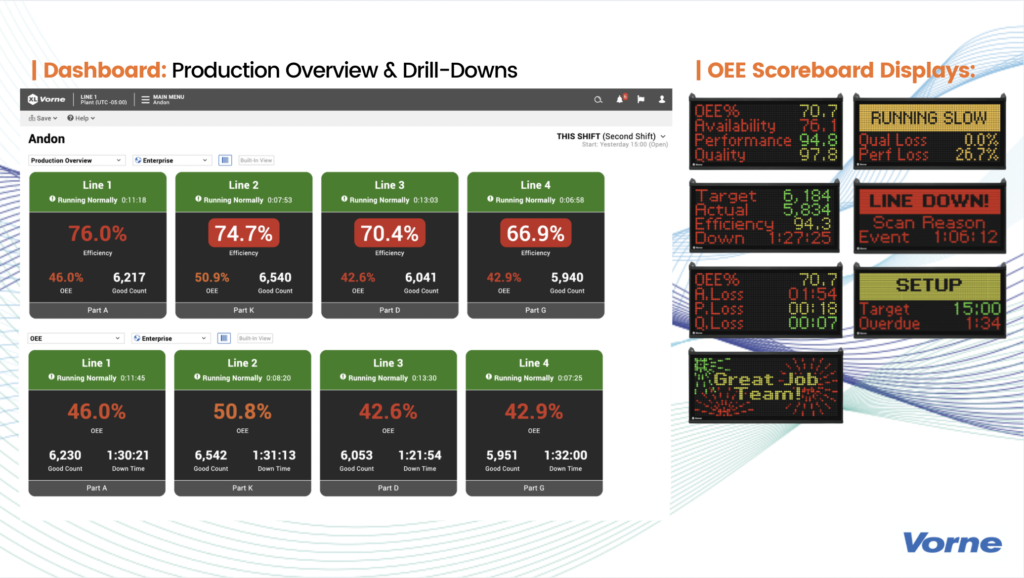
Overall Equipment Effectiveness (OEE) is crucial in identifying the percentage of planned production time that is truly productive. An OEE score of 100% represents perfect production: manufacturing only good parts, as fast as possible, with no down time. OEE score answers questions such as: At any given time, do you know which machines are operating and which are idle? How long does it take to set up a certain job? Is the target achieved for today?
You should keep an eye on the following things in particular:
- Production state (Idling, downtime, producing)
- Line status (e.g. running, stopped, changeover)
- Parts produced (In count: good counts vs. rejects)
- Availability, Performance, and Quality Loss (usually lost time within the shift, job, or part run)
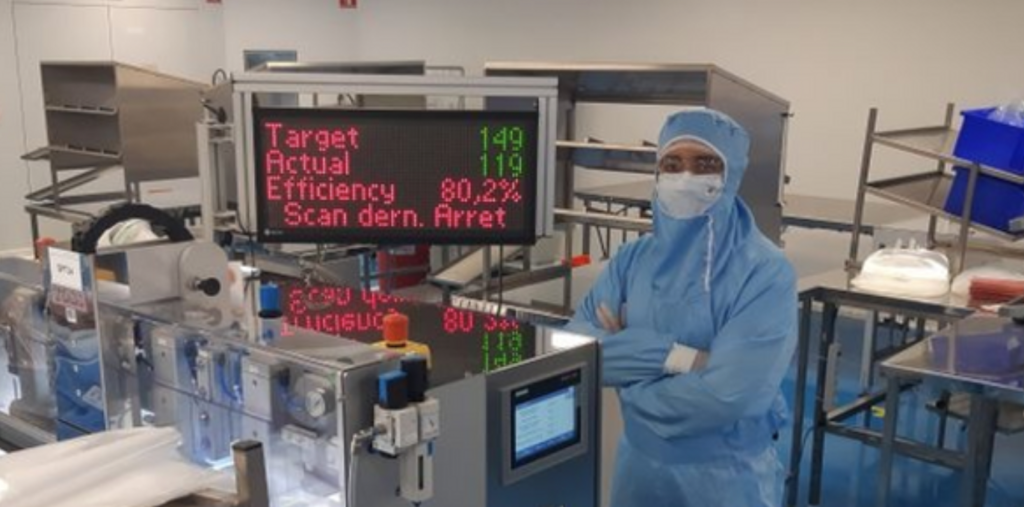
OEE reports are records of what happened in the past. OEE displays are records of what is happening right now – an opportunity to change history before it happens. With plant floor electronic displays that convey OEE and other KPIs performance data in real-time, your team can address issues and solve challenges as they occur with:
- Visual cues to alert when special attention is needed
- Contextual information such as down time during breakdowns, target time for changeovers, and remaining time for breaks
- Automated data capture for high resolution and accuracy
Supervisors making endless rounds on the shop floor will not be able to tell you this as effectively as a solid OEE system will. An effective production monitoring dashboard encourages manufacturing plants to better define the role of plant floor employees to address questions such as:
- What does “green condition” mean?
- When should an operator call for maintenance?
- When should an operator schedule production downtime?
You can use this intelligence to take preventative measures like:
- Enable operators to call for help as needed (e.g. from maintenance or supervisors)
- Setting realistic delivery expectations
- Planning ahead when overtime is needed
- Deploying supervisors only where they’re needed
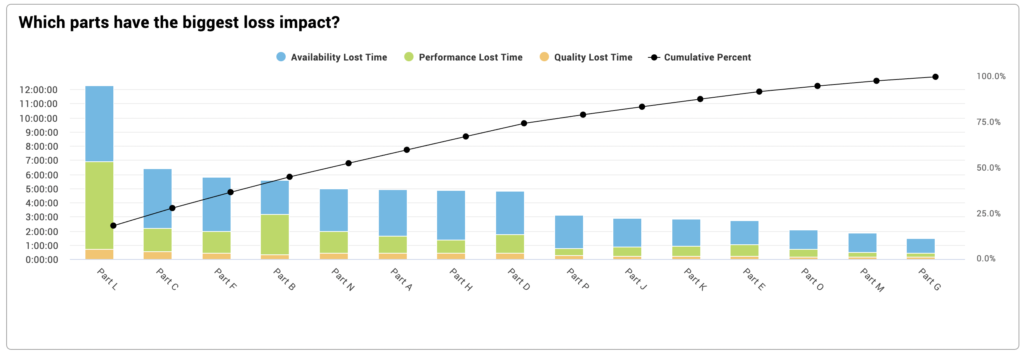
KPI Dashboard #2: Machine Downtime
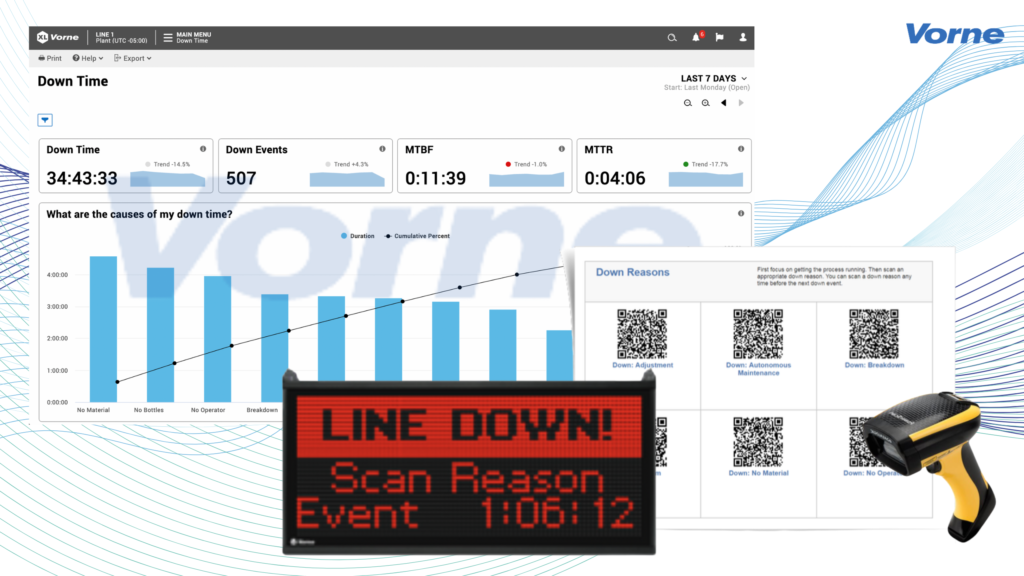
You can’t increase output unless you figure out what’s slowing you down. Monitoring downtime identifies bottlenecks and provides a roadmap for improving performance, hence production monitoring system should be able to pinpoint the sources of downtime by replacing manual tracking of down time with automated tracking (track down time based on equipment inputs rather than operator tick sheets).
Automatically detect your down time using a single input from your equipment (usually an existing sensor that counts parts or equipment cycles)with sub-second accuracy using Vorne. Xl. The XL scoreboard shows down time in real-time on the plant floor and XL provides down time information to employees everywhere using patented technology and its integrated web server.
The dashboard will be able to address questions such as:
- What are the causes of the downtime?
- Which parts have the biggest downtime impact?
- What are the down time trends, top and most most frequent down losses?
- How does the down time vary by shift and part?
KPI Dashboard #3: Workforce Performance
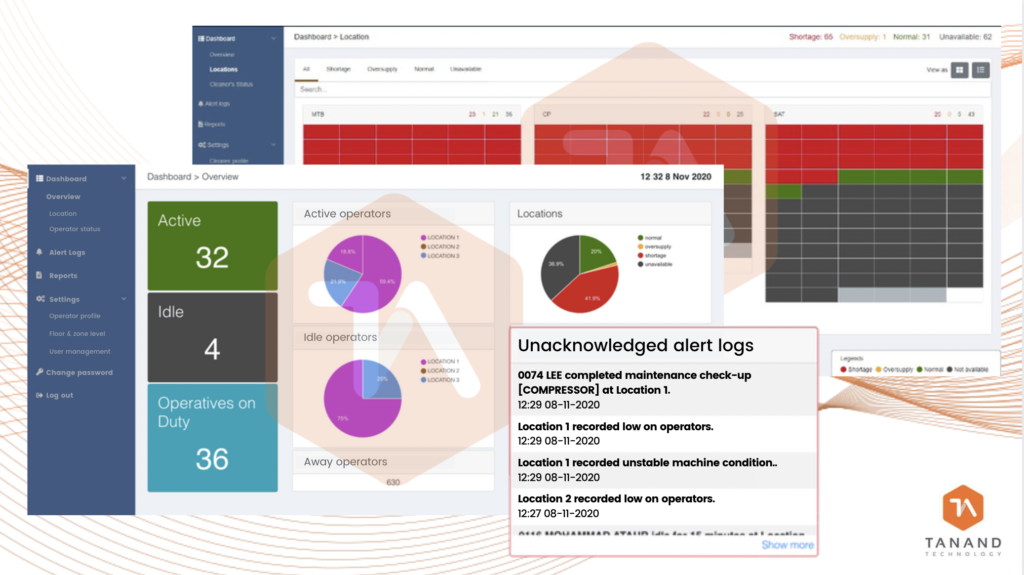
When it comes to enhancing performance—creating accountability and providing targeted incentives—having access to data and facts is the first step.
Your best performers will be identified through a good KPI system, and you will be able to reward and recognise them. Simultaneously, it determines whether operators are efficient in completing their job by providing a historical trail of when events had happened and the details of the follow-up performed.
It is applicable to suituations where:
- to ensure dynamic roster / scheduling and reduce idling when it is challenging to supervise all the operators working in a large area, e.g. cleaners or trolley operators in an airport
- to provide real-time tracking for manpower efficiency when you want to ensure timely completion of tasks, e.g. when maintenance operators go into their designated zone for machine check-ups
KPI Dashboard #4: Your Plant’s OEE
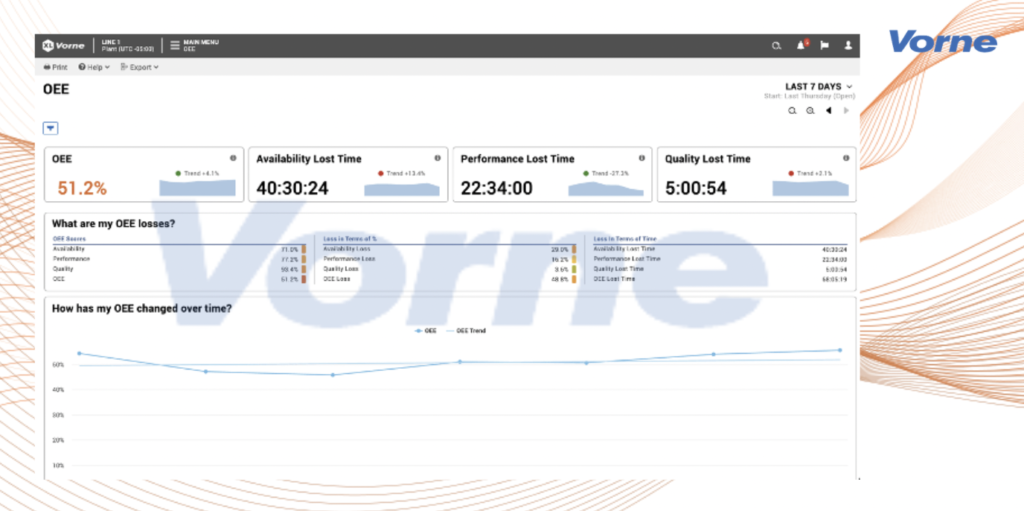
OEE is most valuable when it
(a) categorizes causes of lost production time,
(b) as accurately or brutally as possible,
(c) as a basis for improvement activity.
It’s representative for how your equipment is running, and that the score is improving over time.
You receive a complete picture of your production OEE when you track your plant’s availability, quality, and performance at the highest levels. You can now spot and correct problems as they arise, ensuring that your operational goals are met and exceeded.
- Production Monitoring & OEE
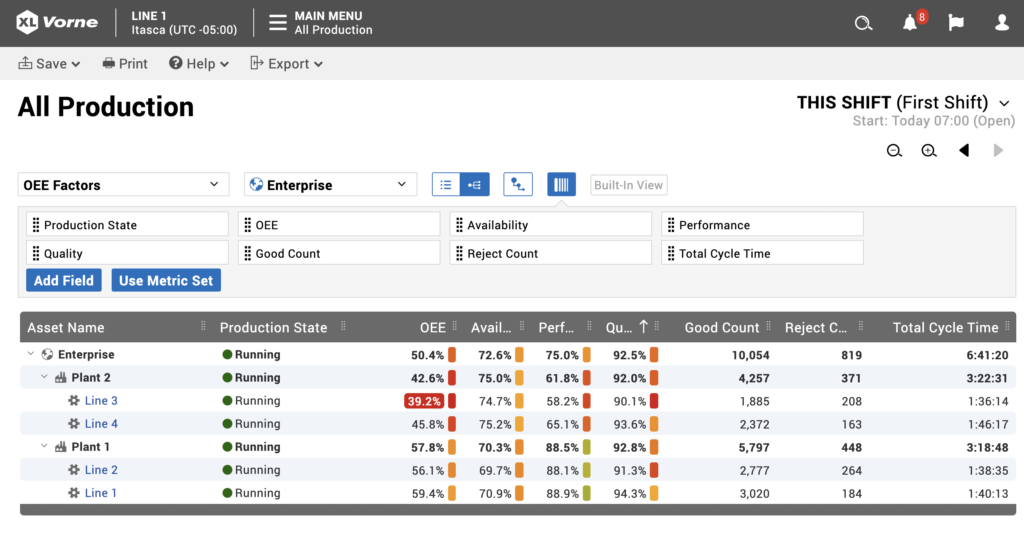
RTMA-OEE is embedded with standard dashboards showing availability, performance, and quality management, which allows detailed monitoring at-a-glance to empower operators to meet production goals by identifying bottlenecks in real-time for continuous production improvements.
- Historical Analytics Comparison Across Lines
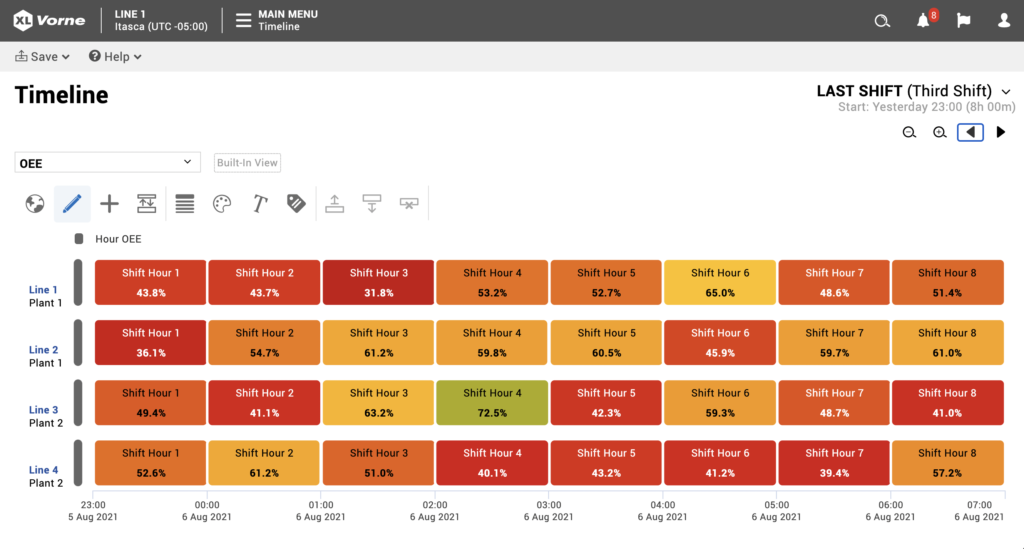
Historical performance and production analytics help determine if jobs will be delivered on-time. Visualize, analyze and optimize actual cycle times (hourly, daily, weekly & monthly; minimum, maximum & average) of multiple machines and lines across production floors for real-time OEE dashboards and historical reporting.

We are passionate to be the technology enabler to realize world’s smartest, most optimized & adaptive buildings & manufacturing processes that save money & improve productivity through the convergence of accelerated technologies & real-time data driven analytics.